

When we think of climate change, the first thing that often comes to mind is a simple, rising line on a temperature graph. But for the world’s forests, the story is far more complex and fascinating. Climate change isn’t just about getting warmer; it’s about a fundamental shift in the very conditions that allow different tree species to thrive, compete, and survive. To truly understand what our future forests might look like, we need to move beyond the thermometer and look at the intricate relationship between water and energy that defines the landscape.
The Great Forest Reshuffle
Climate shapes a forest. It dictates the timing of crucial life events for trees: a process called phenology. Think of it as a tree’s internal calendar: climate cues tell it when to sprout new leaves, when to flower, and when to prepare for winter. As the climate shifts, this timing can be thrown off, putting trees out of sync with pollinators or the seasons they’re adapted to.
More dramatically, a changing climate redraws the map of suitable habitats. A tree species that flourished in a particular valley for centuries might suddenly find the summers too dry or the winters too mild. Meanwhile, a different species, better suited to these new conditions, may begin to move in. This triggers a slow-motion competition for resources like light, water, and nutrients. The result is a gradual but profound taxonomic shift: a reshuffling of the forest’s inhabitants, with new winners and losers.
Beyond Warming: It’s Also About the Water Balance
Focusing only on temperature is like trying to understand a company’s health by only looking at its stock price (it’s an important metric, but it doesn’t tell the whole story). As Dobrowski et al. (2013) highlight, factors related to water are just as critical. This is where the concept of the climatic water balance comes in.
Imagine a bucket in the forest. This is the core idea behind the simple but powerful Thornthwaite-Mather water-balance model described in papers like Abatzoglou et al. (2018).
- Input: Precipitation (rain and snow) is the water going into the bucket.
- Output: Potential Evapotranspiration (PET) is the total amount of water that could evaporate from the ground and transpire from plants if water were unlimited. It’s the atmosphere’s thirst.
- The Reality: The actual amount of water that leaves the system is Actual Evapotranspiration (AET). This can’t be more than the water available in the bucket.
- The Shortfall: When the atmosphere is ‘thirstier’ than the water available (PET > AET), you get a Climatic Water Deficit (CWD). This is a direct measure of drought stress on plants.
Looking at AET and CWD gives us a much richer picture. These variables explain the year-to-year success of forests, from tree growth and seedling survival to the risk of wildfire. They show us that a location might be getting warmer, but if it’s also getting wetter at the right time of year, the forest might do just fine. Conversely, a modest temperature increase combined with a small shift in rainfall timing could create a large water deficit, pushing a forest past its breaking point.
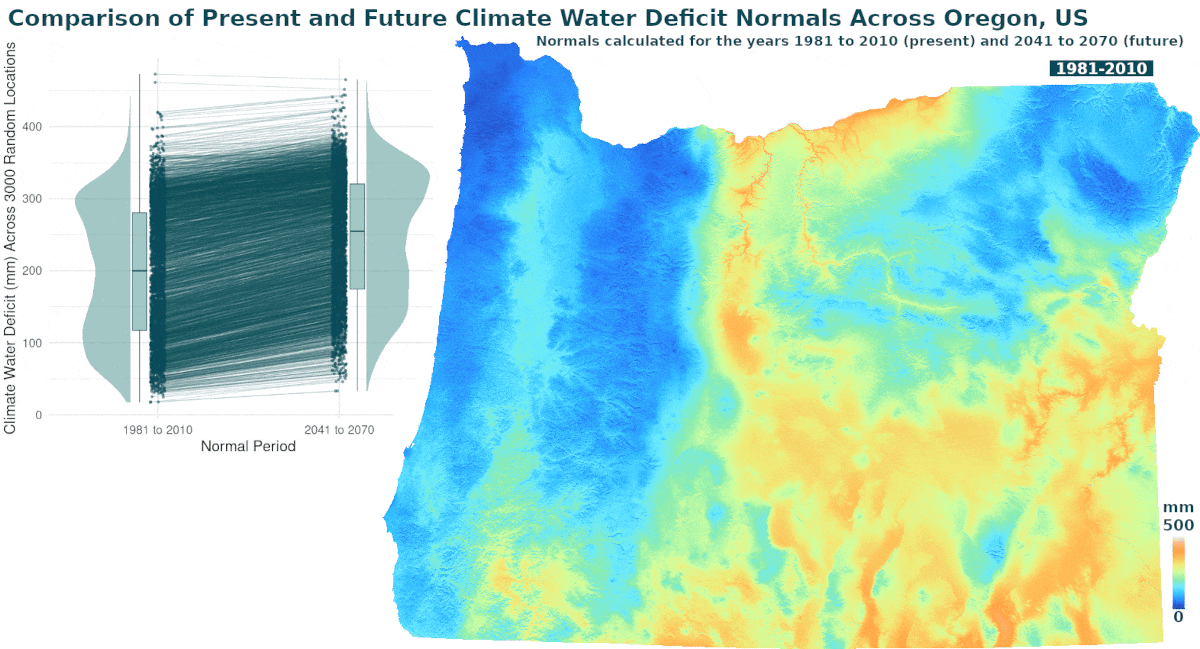
Our analysts at Resilient Forestry have developed robust computational tools to calculate the climatic water balance across whole states. Our tools leverage fine-scale topography, soil, and vegetation data, in addition to multi-temporal climatic layers. Our algorithms are optimized for calculating monthly and annual water balance inputs and outputs at high resolution (e.g., 30- or 90-meter pixels), and for both present and future climatic conditions. Check the animation below. It shows the normal (30-year aggregation) for present (1981-2010) and future (240-2070) climatic water deficit across Oregon.
Finding the Future Today: The Power of Climate Analogs
So how do we make sense of these complex future changes? One of the most intuitive tools is the spatial climate analog. The idea, as explained by Yegorova et al. (2025), is simple: Where on the map today can we find the climate that our backyard is predicted to have in 50 years?
This technique uses space as a substitute for time. We start by learning the future conditions of a location of interest using climate projections. Then, we search for places where those conditions are occurring now. This gives us a glimpse of what the future might hold: what kinds of trees grow there? What does the ecosystem look like? This makes the abstract concept of climate change tangible.
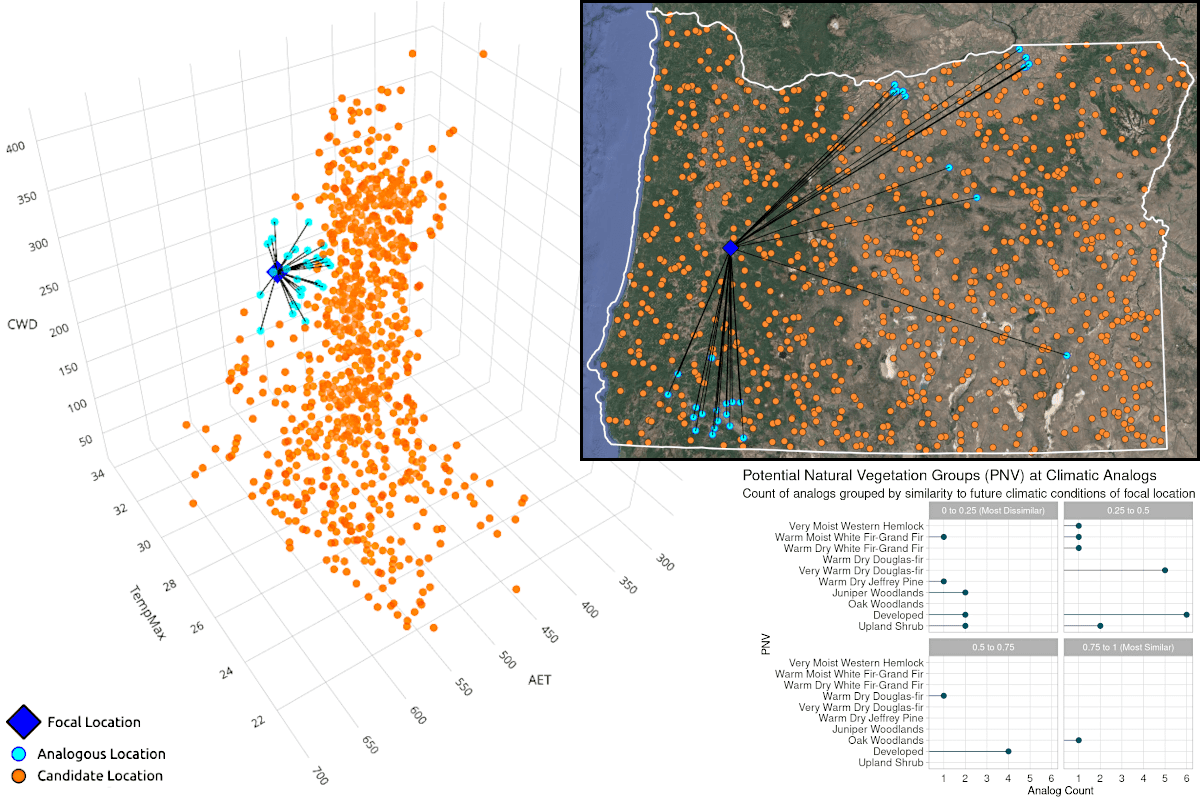
The map below shows the geographic position of a location of interest (i.e., focal location; blue diamond) relative to 900 candidate analogous locations (orange dots), from which 30 ‘true’ analogs were pulled (cyan dots). The 3D graph visualizes this differently, arranging these same locations not by geography, but within a “climate space” defined by three key variables: maximum temperature (TempMax), actual evapotranspiration (AET), and climatic water deficit (CWD). In this climate space, the analogs are the locations that cluster most closely with the focal location’s future climate. The final lollipop chart reveals what this means for the ecosystem. While the focal location is currently a moist western hemlock forest, the vegetation at its most similar analog suggests a future transition toward an oak woodland.
A Better Crystal Ball for Our Forests
When we combine the detailed information from water balance models with the intuitive power of climate analogs, we get a much clearer view of the future. Dobrowski et al. (2021) show that this approach is highly effective for predicting how whole ecoregions (large areas of similar climate and ecosystems) might shift. By using multiple climatic factors, these analog models can project not just the movement of a single species, but the potential transformation of an entire biological community. This ecoregion-centered approach is vital for planning conservation efforts and managing our natural resources effectively.
Of course, no model is perfect. A key limitation of these “space-for-time” models is the assumption that ecosystems can migrate and adapt as quickly as the climate changes, and that other factors like disturbance regimes do not change. However, these tools still provide a useful data-driven glimpse of the forests of tomorrow.
To be good stewards of our forests, we should look beyond simple temperature increases and use integrated tools like water balance models and spatial climate analogs. This can help us to better anticipate the changes to come and make smarter decisions to ensure our forests remain healthy and resilient for generations.
References
Abatzoglou, J.T., Dobrowski, S.Z., Parks, S.A. and Hegewisch, K.C., 2018. TerraClimate, a high-resolution global dataset of monthly climate and climatic water balance from 1958–2015. Scientific data, 5(1), pp.1-12.
Dobrowski, S.Z., Abatzoglou, J., Swanson, A.K., Greenberg, J.A., Mynsberge, A.R., Holden, Z.A. and Schwartz, M.K., 2013. The climate velocity of the contiguous United States during the 20th century. Global change biology, 19(1), pp.241-251.
Dobrowski, S.Z., Littlefield, C.E., Lyons, D.S., Hollenberg, C., Carroll, C., Parks, S.A., Abatzoglou, J.T., Hegewisch, K. and Gage, J., 2021. Protected-area targets could be undermined by climate change-driven shifts in ecoregions and biomes. Communications Earth & Environment, 2(1), p.198.
Yegorova, S.V., Dobrowski, S.Z., Yung, L., Parks, S.A., Bocinsky, R.K., Davis, K.T., Littlefield, C., Maneta, M.P., Wyborn, C., Wurster, P. and Rank, R., 2025. Spatial climate analogs in climate change research, impact assessment, and decision-making. BioScience, 75(5), pp.362-378.