
Managing forest resources has always been a monumental task. The sheer scale and complexity of forest stands make traditional ground-based surveys time-consuming and often incomplete. But what if you could capture an entire forest in stunning, metric detail from the air?
At Resilient Forestry, we leverage cutting-edge drone photogrammetry to do just that. We transform thousands of high-resolution aerial images into precise, actionable 3D data that empowers sustainable and efficient forest management. It’s a process that can seem like magic, but it’s grounded in robust science and a meticulous workflow.
Today, we’re pulling back the curtain to show you exactly how we turn simple pixels into digital trees with our 8-step photogrammetric pipeline.
1. Feature Extraction: Finding the Landmarks
Our process begins not with the forest, but with the individual photos. To build a 3D model, the software first needs to find unique, identifiable landmarks in each 2D image.
Imagine giving each photo to a detective and asking them to circle every tiny, memorable feature, like the tip of a specific branch, a uniquely shaped rock, or a distinct pattern of leaves. These features act as clues that can be recognized across multiple photos. This is the foundation of the entire reconstruction. Without a rich set of unique features, the software can’t connect the photos. In a forest, where textures can be repetitive, extracting high-quality features is the first critical step toward a successful model.
2. Feature Matching: Weaving the Web
Once we have our catalog of landmarks, the next step is to find them in other photos.
The detective now compares the digital fingerprint of every feature from one photo to all the fingerprints in every other overlapping photo. When a match is found, they connect the two photos with a virtual string. After millions of comparisons, we have a complex web of strings that links the entire image collection together. This web of connections provides the structural rigidity for our 3D model. A dense network of tie points is essential for accurately modeling the complex, multi-layered structure of a forest canopy.
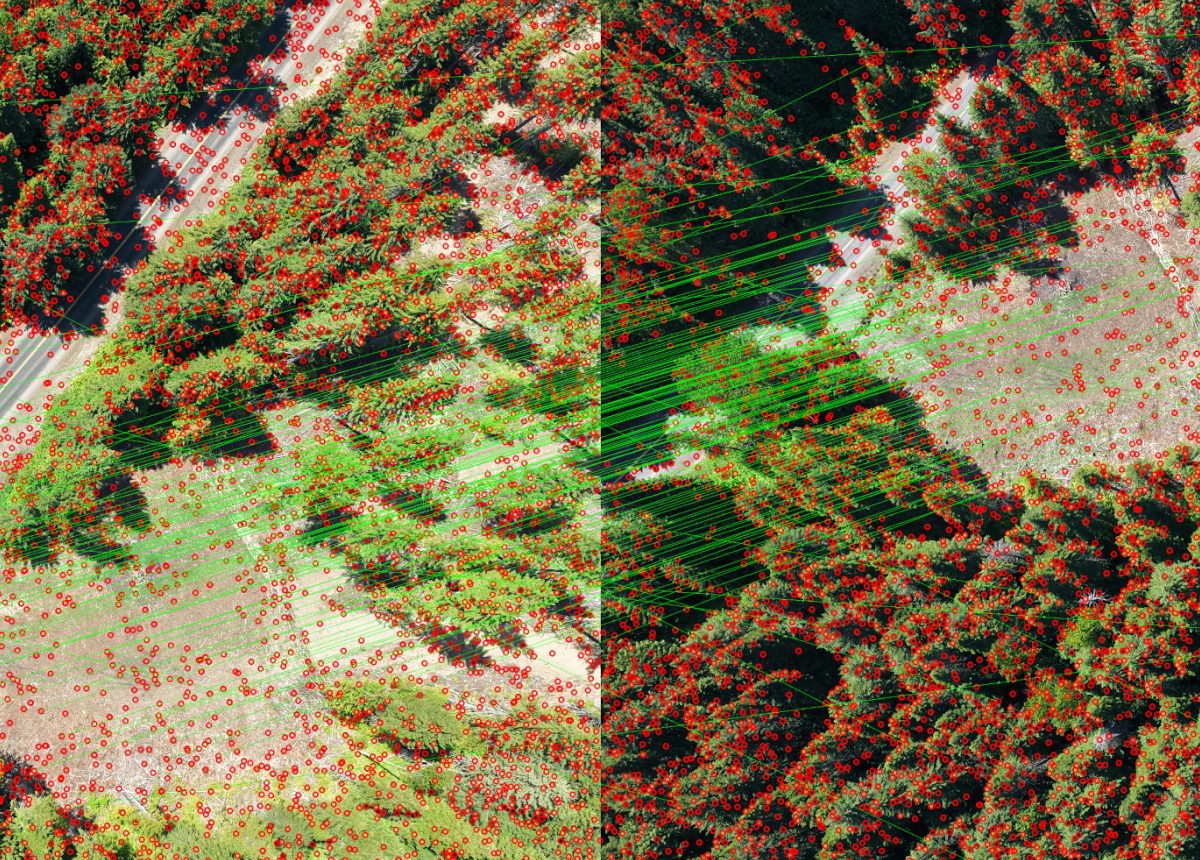
The figure below shows red circles representing the landmarks (features) found across two overlapping drone photos (taken from different angles). The thin, green lines connect each pair of matching features.
3. Sparse Reconstruction: The First Glimpse of 3D
This is the moment where a 3D structure emerges from the 2D images.
This process, known as Structure from Motion (SfM), analyzes the intricate web of tie points to build a rough, skeletal 3D model of the forest. It deduces where each photo must have been taken from in 3D space to create the observed pattern of landmarks. This gives us our first look at the project in 3D: a sparse “constellation” of points and a map of all the camera positions. This step serves as a vital quality check. It confirms that the drone imagery was captured correctly and that all photos align properly. It provides the essential geometric framework upon which all subsequent steps will be built.
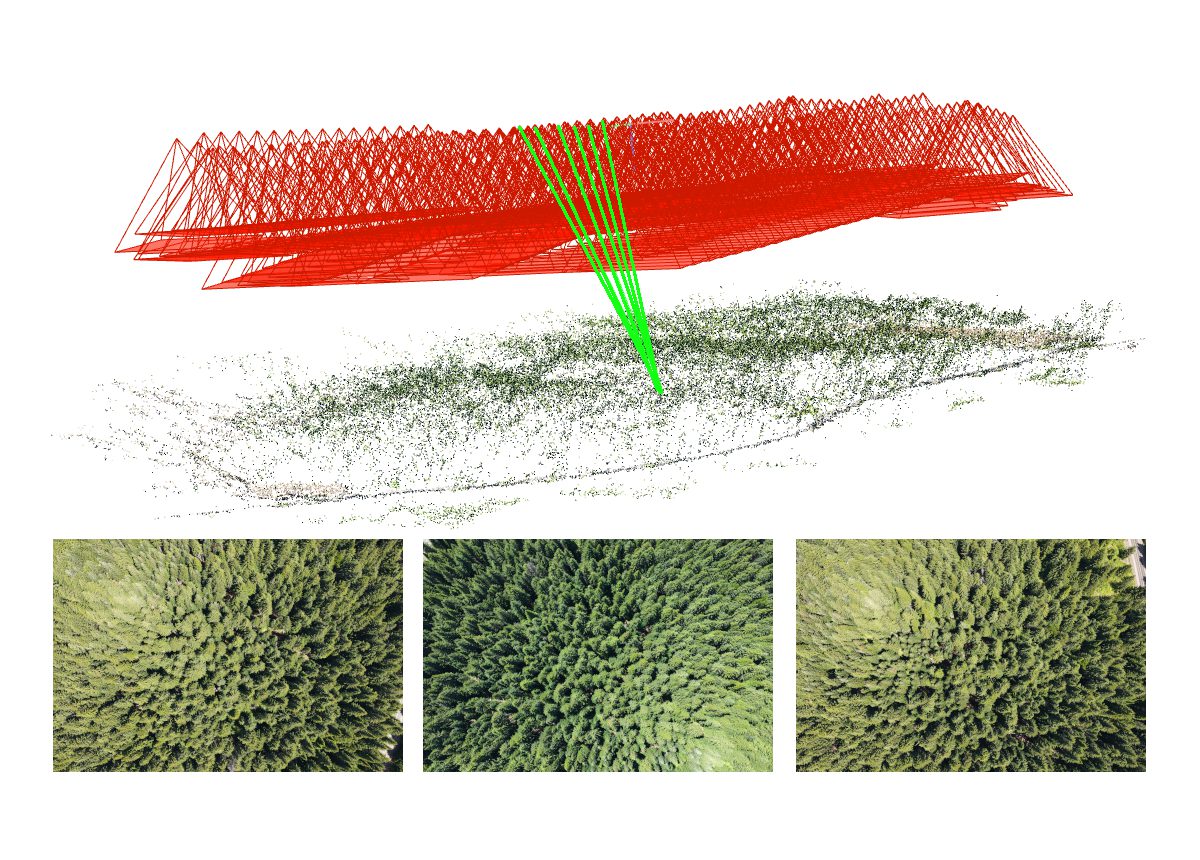
The figure below shows a 3D sparse reconstruction of the forest (green/brown points), and the projection of camera positions and footprints (in red). The thin, green segments connect an XY position with 6 overlapping photos, from which 3 are shown below the 3D structure.
4. Camera Optimization: Achieving Scientific Accuracy
The initial 3D model is geometrically sound, but it isn’t yet precise enough for scientific measurement.
Think of the sparse model as a bit loose and wobbly. Optimization is like having a master craftsperson tighten every single joint to perfection. The software projects the 3D model back onto the original photos and checks if everything lines up. If a point is off by even a fraction of a pixel, it minutely adjusts the camera’s calculated position, its lens characteristics, and the 3D point’s location, repeating this thousands of times until the entire system is mathematically perfect. This is arguably the most critical step for data quality. Camera optimization, aka Bundle Adjustment, is what transforms a rough visual model into a precise instrument, ensuring that our final measurements of tree height, volume, and area are reliable and scientifically valid.
5. Georegistration: Anchoring the Model to the Earth
Our model is now incredibly precise, but it’s “floating” in an arbitrary 3D space. Georegistration anchors it to the real world.
Imagine your perfectly built 3D model is a beautiful, scale-perfect miniature of the forest. You also have a real map of the area with survey-grade coordinates marked with an ‘X’ (your Ground Control Points, or GCPs). Georegistration is the process of picking up your miniature forest, resizing it to the correct real-world scale, and pinning it onto the map so that every landmark in your model aligns perfectly with its corresponding ‘X’. This makes the data spatially aware and interoperable. Without it, you couldn’t overlay your results with other GIS layers like property lines or stand delineations, nor could you accurately compare your data to past surveys.
6. Dense Reconstruction: Fleshing out the Details
With a perfectly optimized and georeferenced camera network, we can now build the primary 3D deliverable.
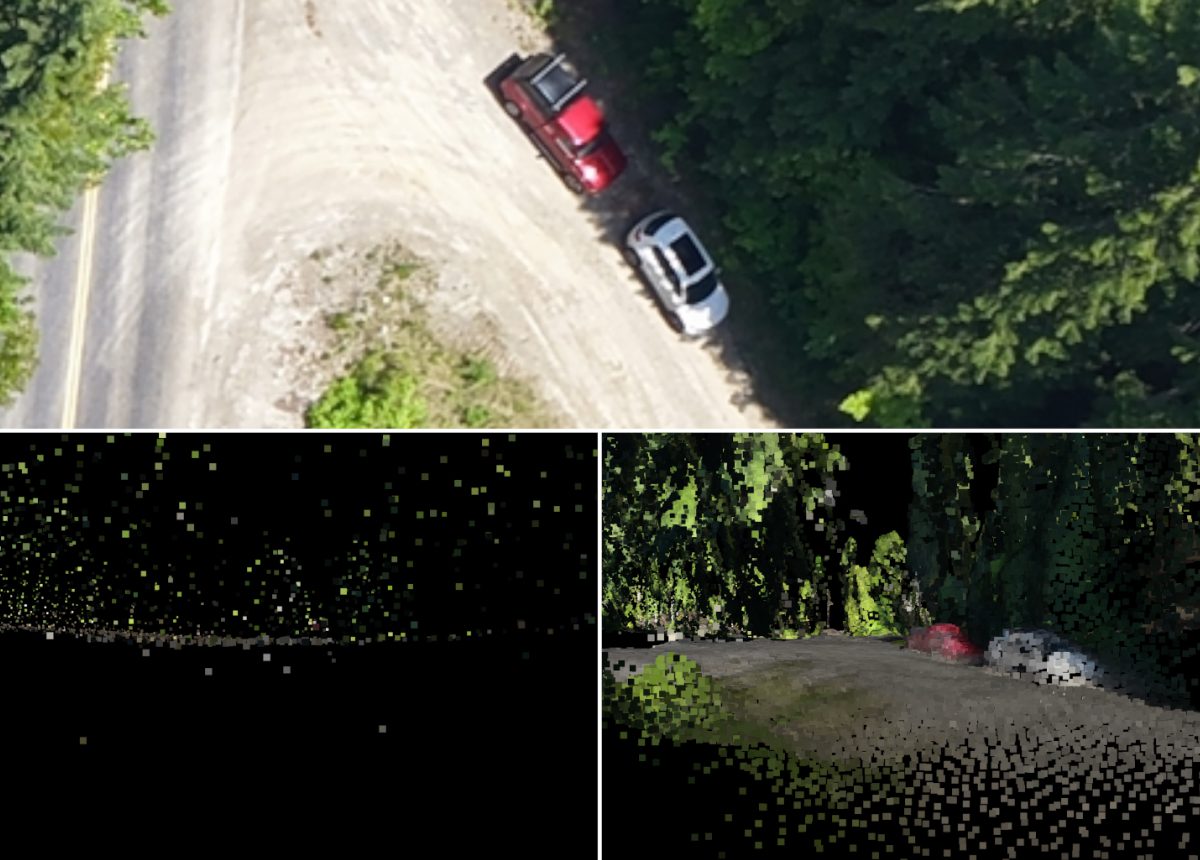
The sparse cloud was just the skeleton. Dense reconstruction, part of the Multi-View Stereo (MVS) suite of techniques, is the process of adding all the muscle, skin, and leaves. Using the camera positions as a reference, the software calculates a 3D coordinate for millions of additional pixels, filling in the gaps and creating a detailed, richly colored, and solid-looking 3D copy of the forest. The dense point cloud is the key to understanding forest structure. Its high level of detail allows for the classification of ground vs. vegetation, the estimation of tree height, crown diameter, canopy complexity, etc. The figure below shows a portion of a drone photo (top), and the sparse (bottom left) and dense (bottom right) 3D reconstructions for the same photo region.
7. Digital Elevation Models: Landscape-Wide Assessment
The dense point cloud is a rich dataset, but for landscape-scale analysis, we often convert it into 2.5D raster maps.
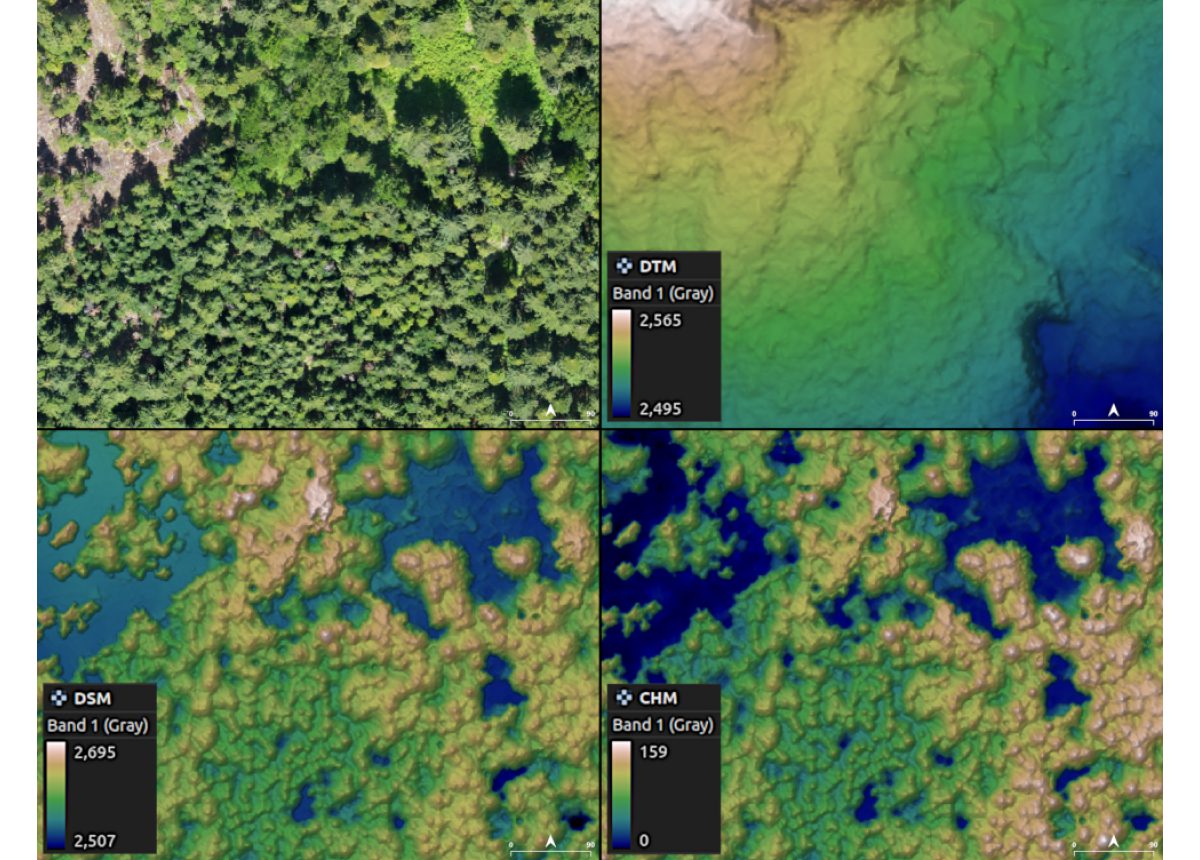
Imagine draping a massive grid over the 3D point cloud. To create a Digital Surface Model (DSM), we record the height of the highest thing in each square (usually a treetop, or a building). To create a Digital Terrain Model (DTM), we first digitally erase all the trees and then record the height of the bare ground. The most powerful result is the Canopy Height Model (CHM), which is simply the DSM minus the DTM, giving us a perfect map of tree heights. These elevation models are incredibly valuable. The DTM is crucial for understanding hydrology, while the CHM provides a wall-to-wall inventory of tree heights, a primary input for biomass, carbon estimation, and harvest planning.
The figure below shows a portion of a drone photo (top left), and the digital models of terrain (DTM, top right), surface (DSM, bottom left), and canopy height (CHM, bottom right). Notice the difference in the unit values (feet).
8. Orthomosaic Generation: The Final Map
The last step is to create a perfect, map-accurate 2D image of the forest.
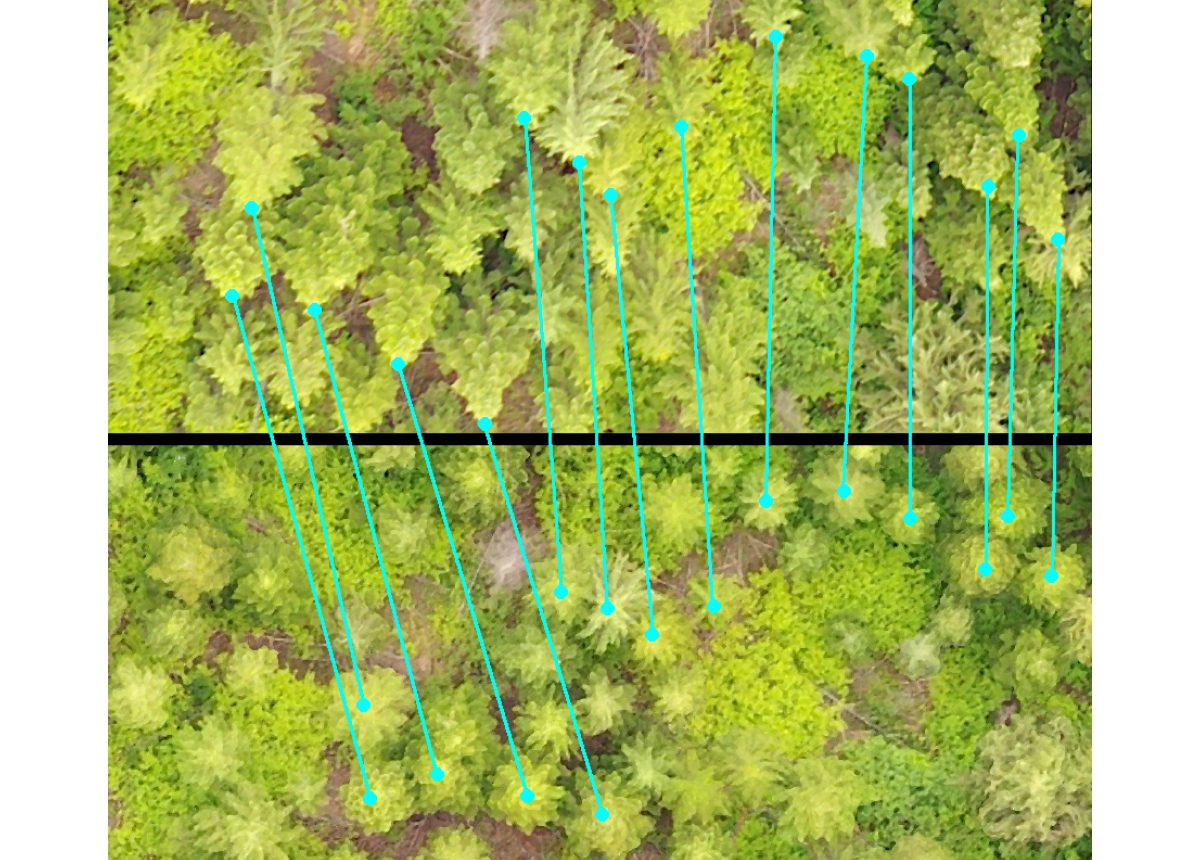
A regular photo has perspective distortion, for instance, tall trees appear to lean. An orthomosaic is a perfect, top-down view with zero perspective, like a high-resolution satellite map. The software digitally drapes the original photos over the 3D surface model (the DSM), effectively pushing all the leaning trees upright so every meter on the map represents exactly one meter on the ground. The orthomosaic is the definitive visual record of your forest. It combines the rich detail of a photograph with the geometric accuracy of a map, making it an essential tool for visual assessment, digitizing stand boundaries, and serving as a current, high-resolution basemap for all your GIS work.
The figure below shows a portion of a drone photo (top) and the corresponding portion of an orthophoto. The cyan segments connect matching treetops between the photos. Notice the perspective removal on the orthophoto.
From Data to Decisions
This 8-step process represents a powerful fusion of photography, computer vision, and geodesy. By meticulously moving from one stage to the next, we transform simple drone photos into a suite of powerful data products that enable smarter, more efficient, and more sustainable forest management.
Interested in seeing how our drone photogrammetry services can provide new insights for your project? Contact us today for a consultation!