
Healthy forests are characterized by a high resilience to the degradation of their ecological functioning and productivity. This resilience allows them to revert to their original state after exposure to external stressors, disturbances, or resource limitations. Accordingly, forest health preservation and restoration programs are key components of both ecological and productive forest management. These programs often focus on modifying the spatial arrangement, biotic composition and structure through silvicultural treatments, which, in turn, reestablish the ecological and productive functioning of forests.
Monitoring the outcomes of forest health treatments is essential to evaluate their success (or lack thereof) and to prescribe subsequent treatments accordingly. The monitoring often relies on plot data, which can become a limiting factor when managing extensive forest areas, particularly within a landscape ecology framework. Landscape ecology emphasizes the relationships between spatial patterns of forest composition, structure, and function across large extensions of land. As a result, having spatially explicit information about health treatments and their outcomes becomes highly desirable.
The development of technologies like digital aerial photogrammetry (DAP) and airborne lidar (light detection and ranging) has facilitated the creation of spatially explicit, comprehensive representations of the outcomes of forest health treatments across vast areas. These digital representations, often presented as maps displaying structural characteristics of forests, prove invaluable for assessing the success of treatments in achieving prescribed conditions. For instance, the effectiveness of variable-density thinning can be evaluated by quantifying the number of trees and their spatial arrangement, as well as measuring the extent of areas left unthinned or heavily thinned. These factors can be assessed on a large scale and monitored over multiple years using datasets derived from DAP and lidar technologies.
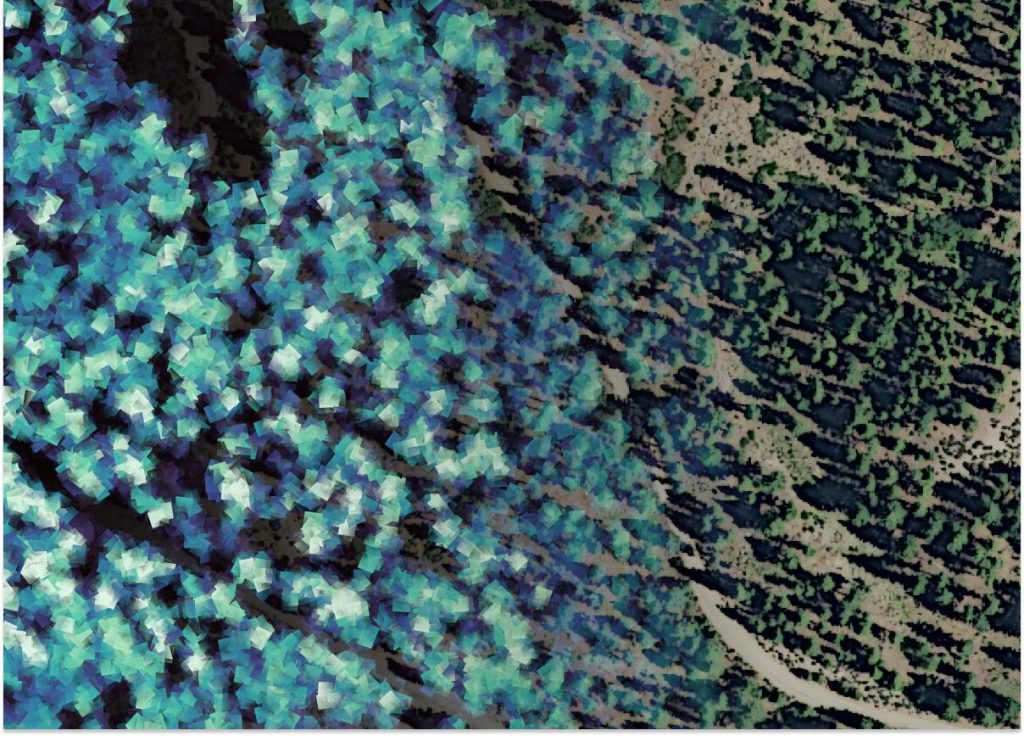
Figure 1 illustrates an example of digital canopy height models (CHM) derived from two different DAP acquisitions (2017 and 2021, pre- and post-treatment) over the Snoqualmie National Forest. CHMs often serve as the primary inputs for the spatially explicit, multitemporal assessment of forest structural conditions.
1.jpg "Figure 1: Comparison of canopy height models (CHM) pre-treatment (2017) and post-treatment (2021). A & B: Aerial image and CHM of the forest stand pre-treatment. C & D: Aerial image and CHM of the forest stand post-treatment.")
Figure 1: Comparison of canopy height models (CHM) pre-treatment (2017) and post-treatment (2021). A & B: Aerial image and CHM of the forest stand pre-treatment. C & D: Aerial image and CHM of the forest stand post-treatment.
The use of DAP and lidar technologies for forest management and health monitoring purposes comes with its share of challenges and trade-offs. Both DAP and lidar aim to represent surfaces in three dimensions (XYZ), but they employ different methods. DAP relies on overlapping photographs taken from various positions, making it a more cost-effective option suitable for covering larger areas over multiple years. On the other hand, lidar uses sophisticated sensors that emit laser pulses, allowing it to penetrate the forest canopy and evaluate understory conditions with reasonable precision. Additionally, the higher number of pulses per unit area results in more realistic representations of canopies through “point clouds” derived from lidar. Figure 2 presents an animation of point clouds representing the surface of adjacent trees.
 |
Figure 2: Point clouds representing the surface of adjacent trees. Left: Point cloud derived from a lidar sensor attached to a drone. Right: Point cloud derived from overlapping photographs taken from an airplane. Note that these point clouds do not represent the same group of trees.
Here at Resilient Forestry, we are actively developing robust methods to harness the potential of DAP and lidar technologies for wall-to-wall monitoring of health treatment outcomes over time. Our approach aims to overcome the inherent limitations of each technology in creative and ecologically sound ways. One of our flagship projects in this regard is the monitoring of forest health treatments across the Colville and Snoqualmie national forests. A crucial aspect of this project is the spatial modeling of patch complexity in treated and untreated stands within these forests over time. Greater complexity, such as live trees of different sizes, multiple canopy layers, and diverse arrangements of forest and gap patches, is often associated with healthier forests. Therefore, transitioning from simpler patch patterns to more heterogeneous ones represents a goal of health treatments that can be effectively monitored using DAP and lidar technologies.
Figure 3 shows a “complexity index” calculated from DAP CHMs (canopy height models) acquired in 2015 (pre-treatment) and 2017 (post-treatment). Despite the limitations of DAP in terms of canopy detail, we can still distinguish between simple forest patches, dominated by trees or gaps, and more complex ones, such as mosaics of tree- and gap-dominated areas.
 and post-treatment (2017). A & B: Canopy height model and complexity index of the forest stand pre-treatment. C & D: Canopy height model and complexity index of the forest stand post-treatment. E: Statistical distribution of the complexity index pre- and post-treatment. Note the shift of complexity values towards 1 (greater complexity) after the treatment.")
Figure 3: Comparison of the complexity index pre-treatment (2015) and post-treatment (2017). A & B: Canopy height model and complexity index of the forest stand pre-treatment. C & D: Canopy height model and complexity index of the forest stand post-treatment. E: Statistical distribution of the complexity index pre- and post-treatment. Note the shift of complexity values towards 1 (greater complexity) after the treatment.
The technology world moves fast, but Resilient Forestry stays at the cutting edge to help preserve and restore your forest’s health. Stay healthy!